
Pie charts are most widely used in business visualizations and there are people who are passionately against and enthusiastically for using pie charts. They are the simplest to understand and easiest to misrepresent.
The 3D pie chart trompe l’oeil

Pie Charts
I use 2D pie charts where appropriate.
However, pie charts have a number of problems. Pie charts don’t work well for more than five to six pies, or when the pies are too small in comparison with other pies in the chart.

Doughnut charts can pack more information, and bar graphs, line graphs, and dot plots are other alternatives to pie charts.
Simple 2D Bar Chart
A simple bar chart takes much less room and is less prone to misrepresentation.

It is still hard to visualize or label smaller data points.
Interactive Bar Chart
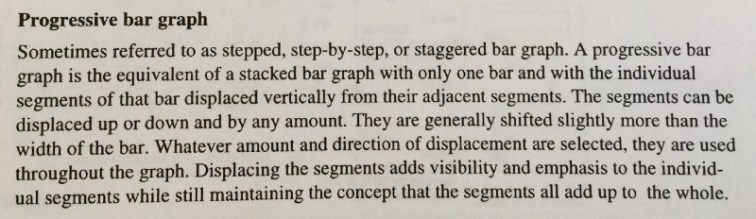
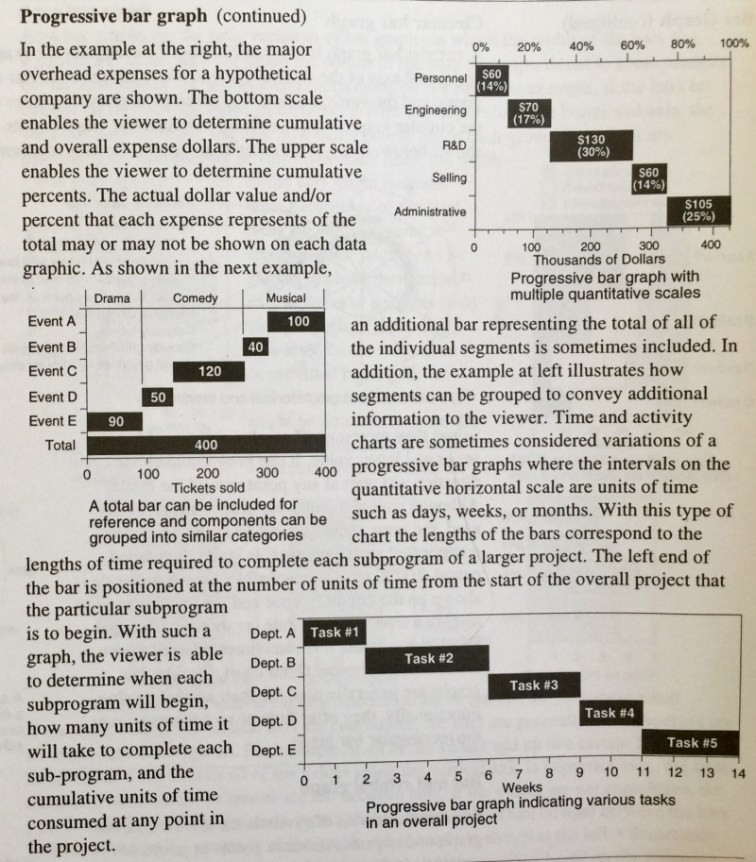
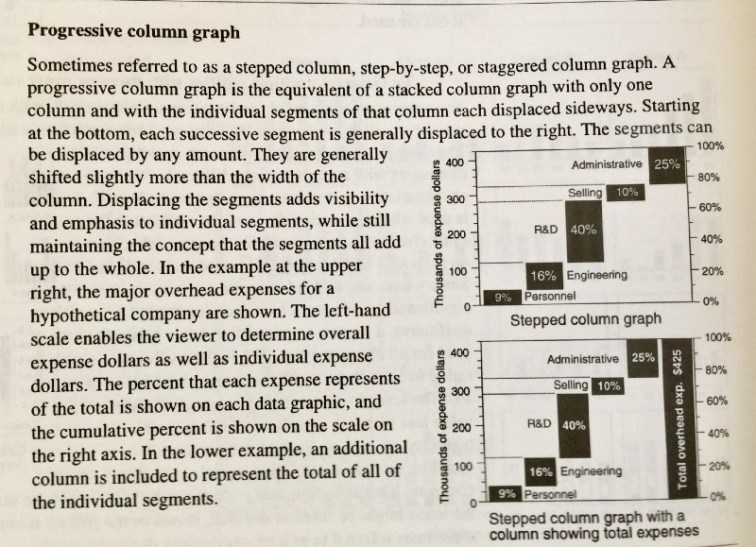
The Interactive Bar Chart is inspired by the Progressive bar graph¹ and the Progressive column graph¹, also known as the Stepped bar graph or the Step-by-step bar graph. A Gantt Chart is an example of a Step-by-step bar graph.
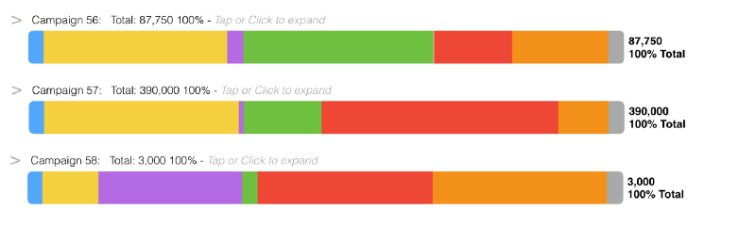
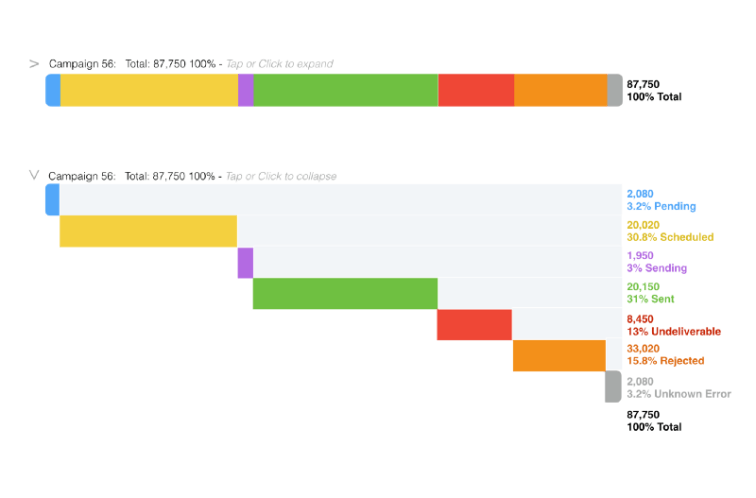
Interactive Bar Chart
An Interactive Bar Chart uses very little space, is intuitive, and interactive. It works well for touch displays and can be programmed to display details when hovering in the collapsed state when used on a desktop.

Upon expanding, the details are shown. Note, even the tiniest of bars is correctly displayed.

Comparisons
The Interactive Bar Chart is easy to compare with other charts and is widely used in NPS comparison charts.
Here is an infographic that uses a stacked bar for comparing statements from presidential candidates via NY Times.

Outro
Interactive Bar Charts work for touch and desktop interfaces are easy to compare, take minimal space, are easy to understand and allow even a number of small values to be displayed. They work as a great alternative to pie charts.
References
- Information Graphics — a Comprehensive Illustrated Reference
Visual Tools for Analyzing, Managing, and Communicating
Robert L. Harris, Oxford Press.
Back
History
- Published July 22, 2017
- Updated on August 6, 2017, to add a reference to Progressive Bar/Column Charts.
