
Follow my publication at DickeySingh.com
Qualitative Reasoning
Most business users and marketers reason and make decisions qualitatively. For example, a business user might want to drive revenue for mobile app users between the ages of 22 and 36, who are highly engaged in a product but have not spent on any in-app purchases.
“Highly Engaged” and “Low Revenue” are qualitative identifiers. Equivalent quantitative identifiers could be “use the app for at least 5 minutes” and “have spent at least $2.99 in in-app purchases.”
Qualitative tags can be generated using supervised classification (Novice user, Expert User) and unsupervised clustering algorithms (Low or High Usage).
When you make a product that is as close as possible to how business users think and decide, you will have much higher usage and success.
Qualitative Scales
Business users would describe engagement on a qualitative scale as Low, Medium or High level of user engagement with a product.
Similarly, Lowest, Low, Medium, High, or Highest in-app purchases are five qualitative segments for in-app purchases.
Ten-point scales
Ten-point scales are common when collecting attitudinal data. In Customer Satisfaction net promoter score (NPS) is calculated as a difference of percent of people who gave a score of 9 or higher (i.e. promoters of a product), and percent of people who gave a score of 6 or lower (detractors of a product) on a 10 point scale, to the likelihood to recommend question.
2-point scale
The two-point scale — thumbs up and thumbs down — was popularized on Mobile and music apps, for ease of use.
5-star-scale
Mobile- and e-commerce brought the five-star rating scale for products, services, and apps
5-point Likert scale
A five-level Likert scale works quite well for qualitative intelligence for certain types of algorithms where predictability in clustering levels is far more important.
For average usage, the qualitative scale could be:
- Lowest usage
- Low usage
- Medium usage
- High usage
- Highest usage
Classifications
Classifying users as “Expert” or “Novice” is another type of qualitative tagging. More about that shortly.
Quantitative Analysis
We often make statements such as engagement for the June 2017 cohort for females between the ages of 28 and 36 was 2 minutes and 12 seconds.
So, 2 minutes and 12 seconds could be excellent for a photography app, but low for a creative photo-editing app.
Similarly, 10.3 seconds of engagement may be high on a watchOS app but extremely low for a tvOS app.
Mapping Qualitative to Quantitative
Qualitative requests can be easily transformed into quantitative actions using appropriate algorithms for easier and automated analysis across products, channels, and platforms.
Request: Drive revenue by sending a promotion for an in-app purchase for mobile app users between ages 22 and 36 who are highly engaged but have not spent on any in-app purchases
Action: Drive revenue by sending a promotion for an in-app purchase for mobile app users
1) between ages 22 and 36,
2) whose daily average engagement is between 5 minutes 11 seconds, and 8 minutes 51 seconds in a particular photography app and
3) who have spent less than $1.99 in in-app purchases
Qualitative requests can span different products with ease. Consider the action that spans two apps.
Action: Drive revenue by sending a promotion for an in-app purchase for mobile app users:
- between ages 22 and 36,
- a) whose daily average engagement is between 5 minutes 11 seconds and 8 minutes 51 seconds and who have spent less than $1.99 in in-app purchases in the photography app OR
b) whose daily average engagement is between 25 minutes 19 seconds and 48 minutes 51 seconds and who have spent less than $4.99 in in-app purchases in the photo- editing creative app
Business user-specified intervals and machine learning algorithms like unsupervised clustering and supervised classification can be used effectively for Qualitative Analysis.
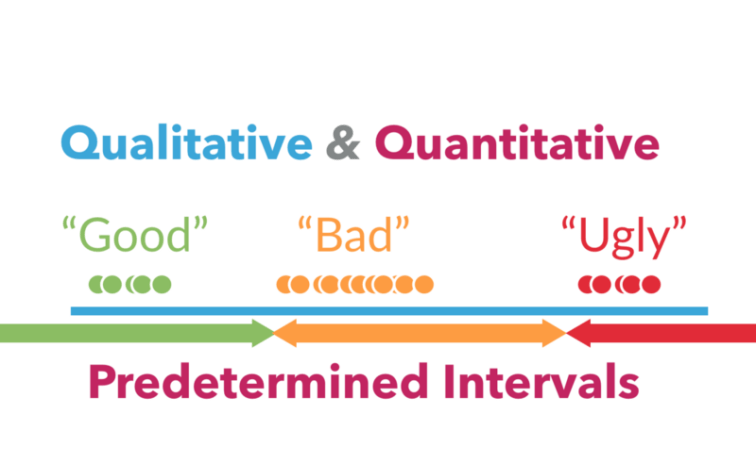
1. Fixed predetermined Intervals
The easiest way to convert is to ask the business user for fixed ranges per product. For example, the predetermined intervals for daily average engagement could be as follows.
- Lowest Engagement: < 2 minutes
- Low Engagement: >= 2 and < 4 minutes
- Medium Engagement: >= 4 and < 10 minutes
- High Engagement: >= 10 and < 20 minutes
- Highest Engagement: >= 20 minutes
2. Clustering using Unsupervised Machine Learning
Using an appropriate clustering algorithm for determining Low to High engagement is a better alternative. However, clustering at scale introduces a number of challenges.
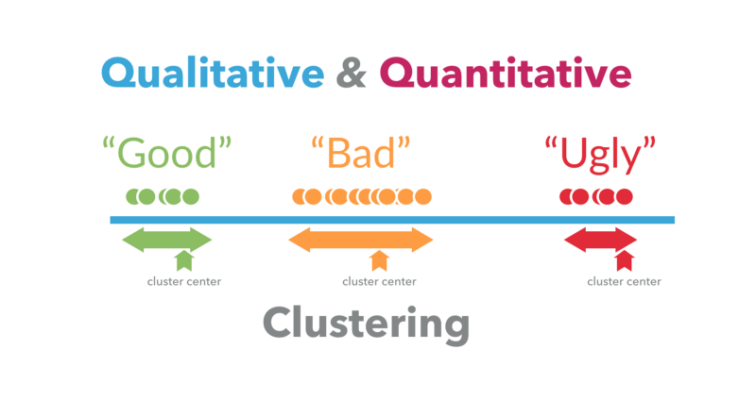
K-Means Clustering
Engagement, in this case, can be clustered into 5 segments using typical K-Means algorithm for narrow datasets.
- Lowest Engagement: < 2 minutes — center 1.4 minutes
- Low Engagement: >=3.5 and < 3.8 minutes — center 3.77 minutes
- Medium Engagement: >= 7 and < 8.5 minutes — center 7.77 minutes
- High Engagement: >= 16 and < 22 minutes — center 20 minutes
- Highest Engagement: >= 38 < 76 minutes — center 40 minutes
K-means++ and parallel clustering
When performing clustering for thousands of dimensions across millions of products, more efficient algorithms should be used.
See K-Means++ and Parallel K-Means.
Manual and Statistical Data Cleansing
It is a good idea to drop bad data when clustering to avoid skewing. See Outliers section here.
Non-Numeric Data
Non-numeric data can be converted into numeric data case-by-case and where it makes sense.
For example, “Palo Alto, California” could be converted to 5.6 miles from office for a specific use-case.
3. Qualitative Classification using Supervised learning
Qualitative tags can be used directly in queries. For instance, you can use user behavior to determine and classify if the user is a novice or expert user. You can show tours to first-time users during onboarding and users who have not used the product for a while and could benefit from retaking the tour.
With Qualitative classification, requests can be quite compelling. Creating tags via supervised classification is specific to the product, but its use for qualitative analysis is similar to segments created using unsupervised clustering algorithms.

Request: Drive revenue by sending a promotion for an in-app purchase for mobile app users between ages 22 and 36 who are experts and highly engaged but have not spent on any in-app purchases.
Qualitative Analytics bridges the gap between how business users think, compared to how machines interpret data. Supervised classification, unsupervised clustering and even business user-specified intervals can be used effectively for Qualitative Analysis.
