
“Don’t be afraid of the trial-and-error approach” — Estee Lauder

Product companies have been using A|B Testing for over two decades. Here is the oldest definition I found on the internet.
A lot of product companies try A|B testing and give-up as it does not produce results or desired results.
Understanding A|B testing, experimentation traffic, pre-segmentation, commitment needed, and accounting for outliers, can be the difference between successful and unsuccessful A|B testing.
A|B Testing
A|B testing is a commonly used term for a controlled experiment to find the better of two (or more) variants, based on an objective or goal. The variant A (the “control” variant) is compared with variant B (the “variation” or “treatment”) to increase an outcome of interest.
Bucket Testing
Bucket testing is another synonym for A|B testing and was popular decades ago, but the idea is the same. You put the visitors of a site in different buckets and show them variations.
Two-sample hypothesis testing
The statistical name for A|B testing is two-sample hypothesis testing. Two sample comes from the two variations, and you are testing a postulation that one variation will perform better than the other.
Real-world examples
- Which one of the two variations of the onboarding process do users complete?
- Which one of two advertisement layouts or copies gets more click-throughs?
- The popularity of hamburger menu versus explicitly labeled “Menu” on a mobile app?
- Which one of two testimonials get more click-throughs?
- Which one of two landing page gets more click-throughs?
- Which one of two email subject lines get more opens?
Experimentation Traffic or Segment
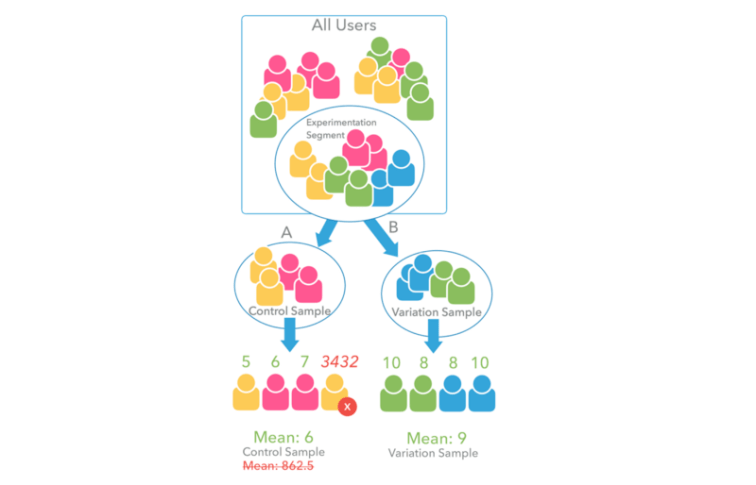
Experimentation segment or Experimentation traffic is a portion of the total traffic, you want to use for the controlled experiment. You direct a sample or portion of the experimentation traffic to control variant (control sample) and another portion to the variation (variation sample).
I will revisit experimentation segment when I talk about the importance of segmentation in A|B Testing below.
Over enough time and traffic, you determine the better of the two variants by looking at which sample produces better results. The conversion success rate for an A|B test would be the ratio between the count of successful conversions, and the size of the sample.
For example, variations of testimonials were shown to 10% of the total one million users, i.e. the experimentation traffic or segment was 100K. 52K were shown the control variation and 48K were shown the treatment variation. Further, 3120 users from the 52K control sample clicked on the testimonial and 2640 users from the 48K treatment variation clicked on the testimonial. In other words, the control variant received 6% and treatment variant received 5.5%.
Network Bucket Testing & Experimentation Traffic
How you choose the experimentation traffic depends on what you are testing. For instance, in a social network, A|B testing a new social feature that will only produce an effect if a user and some number of his or her friends are exposed to the social feature. See Facebook’s Network Bucket Testing.
Split-Run Testing
A Split-run testing or Split-testing is a 50/50 A|B test, i.e., both samples are of the same size.
Objective or Goal
The criteria to test the variations should be selected with a clear understanding of desired outcomes.
“How many people click through a link” and “average revenue per user” are two distinct objectives.
Here are some commonly used testing objectives used by marketers:
Conversion Rate (CR),
Click-through Rate (CTR),
Mean Usage (Time on app, website, webpage, an app screen or game scene),
Average Revenue Per User (ARPU),
Average Retention,
Renewal Rate,
Average Transactions Per User,
Net Promoter Score (NPS),
Customer Satisfaction Rate,
Bounce Rate,
Average Order Size,
Net Profit, etc.
Outliers
Further, always account for skewness and outliers in data. For instance, instead of using Mean Time on screen, consider using Trimmed mean, Tri-mean or Winsorized Mean.
In a 10% trimmed mean the largest and smallest 10% of the values are removed and then the mean is taken on the remaining 80%.
Winsorized mean is similar to the trimmed mean, except that rather than deleting the extreme values, they are set equal to the next largest (or smallest) value, preserving the divisor count in mean.
Sidebar (Statistics 101)
Mean (Average) — In statistics, the arithmetic mean, or the mean or average, is the sum of a series of numbers divided by the number of numbers in the series.
For example, average of following numbers is 253.8
μ = 250+272+240+230+255+271+275+245+260+240 = 253.8Median — Median is either the middle value of an odd data set, or the average of two middle values of an even data set.
>For example, the median of following numbers is 252.5
230, 240, 240, 245, 250, 255, 260, 271, 272, 275
M = (250 + 255)/2 = 252.5Tri-Mean — Trimean is a better estimator and measure of center of data, in a way that it is resistant to skewing outliers. By incorporating the first and third quartiles in the calculation of the trimean, we include some information about the rest of the distribution of the set of data, as opposed to Median that always drops non-central data and mean that always includes it.
Overall Median for 230, 240, 240, 245, 250, 255, 260, 271, 272, 275 is 252.5 as above.
Median of bottom half of data i.e. first quartile: 230, 240, 240, 245, 250 is 240
Median of top half of data i.e. third quartile: 255, 260, 271, 272, 275 is 271
Trimean gives twice the weightage to overall median and is average of Median of first quartile, third quartile and twice the overall median
Tri-Mean = (240 + 2 x 252.5 + 271)/4 = 254.0Winsorized Mean — When data is skewed or has outliers, an obvious technique most analysts use is to remove or trim out the outliers. Mean with trimmed data is known as Trimmed mean. In a 10% trimmed mean the largest and smallest 10% of the values are removed and then the mean is taken on the remaining 80%. Note Median is type of trimmed mean, which is simply the 50% trimmed mean. Winsorized mean is similar to the trimmed mean, except that rather than deleting the extreme values, they are set equal to the next largest (or smallest) value, preserving the divisor count in mean. Product Managers prefer winsorized mean over trimmed mean to eliminate outlier data.
For example, consider following:
Series: 250, 272, 240, 230, 255, 271, 275, 245, 260, 240
Sorted: 230, 240, 240, 245, 250, 255, 260, 271, 272, 275
Trimmed: 230, 240, 240, 245, 250, 255, 260, 271, 272, 275
Winsorizing at 20%: 240, 240, 240, 245, 250, 255, 260, 271, 271, 271
Winsorized Mean = (240+240+240+245+250+255+260+271+271+271)/10 = 254.310
Statistical Significance
Is the difference between results of two variants significant enough to make a decision? You would want to make a change that produces a significant change in the desired outcome. Is the difference statistically significant?
You can use statistics to figure out if the change is statistically significant, but which statistical significance test to use depends on your objective and the sample data. For instance, Fisher’s Exact Statistical Significance Test works best for Click-through Rate (CTR), and Pearson’s chi-squared test works better for “Purchase by Genre.”
Conversion Rate Optimization via Continuous A|B Testing
A|B testing can be used every time you want to introduce a new variant and used continuously to test various imagery and titles for a specific objective.
Rather than waiting for the entire experimentation to conclude, you can end the experiment early to prevent showing bad experiences to a poorly performing variation. Alternatively, you can reroute traffic from poorly performing variations to better performing variations. You are less focused on a specific A|B test but are optimizing for conversions.
Multi-armed Bandit
Rerouting traffic to better performing tests can be implemented by multi-armed bandit technique. Learn more about Bandit Tests versus A|B tests. Understand the pros and cons of this technique and figure out when it should and should not be used.
Multi-sample Hypothesis Testing or A|B|N Testing
When you use one control variant and multiple variations in the same test, A|B testing may be referred to as A|B|N Testing or what I call Multi-Sample Hypothesis Testing (as opposed A|B testing which is two-sample hypothesis testing of one variable). For example, having five total varying layouts and sending 20% of the experimentation traffic to each of the five variations.
Multi-variate Testing
Experimenting with multiple variables simultaneously where each variable could have two or more variations, is multi-variate testing (as opposed to A|B testing, which is two-sample hypothesis testing of one variable). The total number of variations is the product of the number of variations of each variable.
For example, you could check three button colors (red, blue, green), two button labels (“Get Product,” “Get Product Now,”) and button positioning (left edge of top menu, right edge of top menu, center of top menu, middle of visible area of page). Total variations for three variables in this example would be 3 x 2 x 4 = 24.
One-size fits all approach vs. Segmentation
- Not all customers are the same. Why would you treat them the same way
- You cannot treat existing customers the same way as potential customers.
- You cannot treat recently acquired customers the same as a customer that has been around for years.
- You cannot treat mobile customers the same way as web or kiosk customers.
Who you A|B test should be predetermined. The experimentation traffic should not be chosen randomly from the entire population. Rather, the experimentation traffic should be a segment of users carefully selected for A|B test.
Your best A|B test variation may work for 62% of the users. This also means it does not work for 38% of the users. When you know about users, personalizing content, interfaces and messaging always provides much better experiences. And, you always know something about visitors, even first-time visitors.
Choosing a right segment as your experimentation traffic, makes the A | B testing much more reliable and actionable. Automated segmentation tools make selecting the right experimentation traffic simpler.
You can use a number of segmentation techniques to pick the experimentation segment. Demographic segmentation is popular but behavioral segmentation provides better results.
Post A|B test Analysis
Selecting the experimentation traffic or segment for A|B Testing improves experiences.
In addition, you can also do the A|B test analysis separately, post A|B test, for various segments in addition to the entire experimentation segment. “Maybe weekend traffic behaves differently from week-day traffic.”
As another example, measuring for objective: average attention span, you may see the following results in a three-sample single variate test.
- Mean Attention span for control variation: 12%
- Mean Attention span for treatment variation 1: 10%
- Mean Attention span for treatment variation 2: 15%
I.e. treatment variation 2 is the winning test. However, analyzing for mobile visitors only may yield different results, indicating treatment variation 1 is way better than the control variation and slightly better than treatment variation 2.
- Mean Attention span for control variation: 6%
- Mean Attention span for treatment variation 1: 14%
- Mean Attention span for treatment variation 2: 13%
The marketer may conclude using treatment variation 1 for mobile visitors and treatment variation 2 for web visitors.
Reinforcement Learning
A dog trainer can reward a dog for positive behavior and punish for negative behavior. Over time the dog figures out and learns actions it took to get a reward.
In Artificial Intelligence, Reinforcement Learning is in between supervised learning and unsupervised learning dealing with learning in sequential decision-making problems in which there is limited feedback. It is widely used in game theory, multi-agent interaction, robotics, autonomous vehicles, medicine and industrial logistics to learn best actions based on a reward and punishment system. A navigating robot learns how to navigate when rewarded for staying on course and punished when it collides with something in the environment. This reward and punishment feedback reinforces which actions to perform and which to avoid.
Markov Decision Process is the mathematical framework for modeling decision making used in defining solutions in reinforcement learning. The environment consists of a set of states, a set of actions, positive and negative reinforcement rewards, policies and the decision maker.
In section Conversion Rate Optimization via Continuous A|B Testing, I mentioned how you can end bad variations early or re-route traffic from poorly performing variations to better-performing variations dynamically.
Reinforcement Learning lends itself to A|B testing where the system can learn and bad variations can be removed in favor of better performing variations.
Outro
A|B testing has been around for over two decades. Yet, not everyone one is getting value from it. A lot of businesses try A|B testing early and give-up as it does not produce results. It takes time to collect data and analyze results. Typical A|B tests can span anywhere from 1 week to 9 weeks. Only 14% of the A|B tests produce statistically significant improvements, per ConversionXL (Conversion optimization agencies do get higher results).
With the exception of large players who run thousands of A|B tests simultaneously, very few businesses are accounting for outliers when calculating objectives, taking advantage of segmenting the users for finding the right segment to A|B test, and performing meaningful post A|B test analysis using segmentation.
Artificial intelligence makes continuous optimization better as AI is best suited for sensing and reacting to environments. AI is already being used successfully to test variations and determining what works best in real-time. Businesses can run multiple tests simultaneously. A certain class of variations can be created automatically and tested with small audiences. AI algorithms can determine the best variation from 100s of thousands of variations but by only testing fewer than 100 variations based on Evolutionary Computation and Massively-Parallel Multivariate Testing.

One thought on “✨ 20+ years of A|B Testing: Bucket Testing to Reinforcement Learning”
Comments are closed.